Willa Kopp-DeVol, a Junior at Animas High School in Durango, Colorado, recently served a 3 week internship at the Space Science Institute (SSI) in which she worked with both the research and education departments. Her school’s Leading Internships for New Knowledge (LINK) Program takes students beyond the classroom walls in order to clarify personal, college and career goals while teaching invaluable professional skills and life lessons.
Over the next few weeks and starting with this blog, we’ll be posting her personal thoughts on her internship experience.
Research Department of SSI
By Willa Kopp-DeVol (April 22, 2019)
Today was the first day of my internship!
I worked with Travis Metcalfe, a researcher at the institute. First, I interviewed him about his daily work, accomplishments, and interests. His main job is to analyze data from space (space data!) about the sun’s oscillations and sun-like stars in our galaxy. This is called Asteroseismology (other stars) or Helioseismology (our sun).
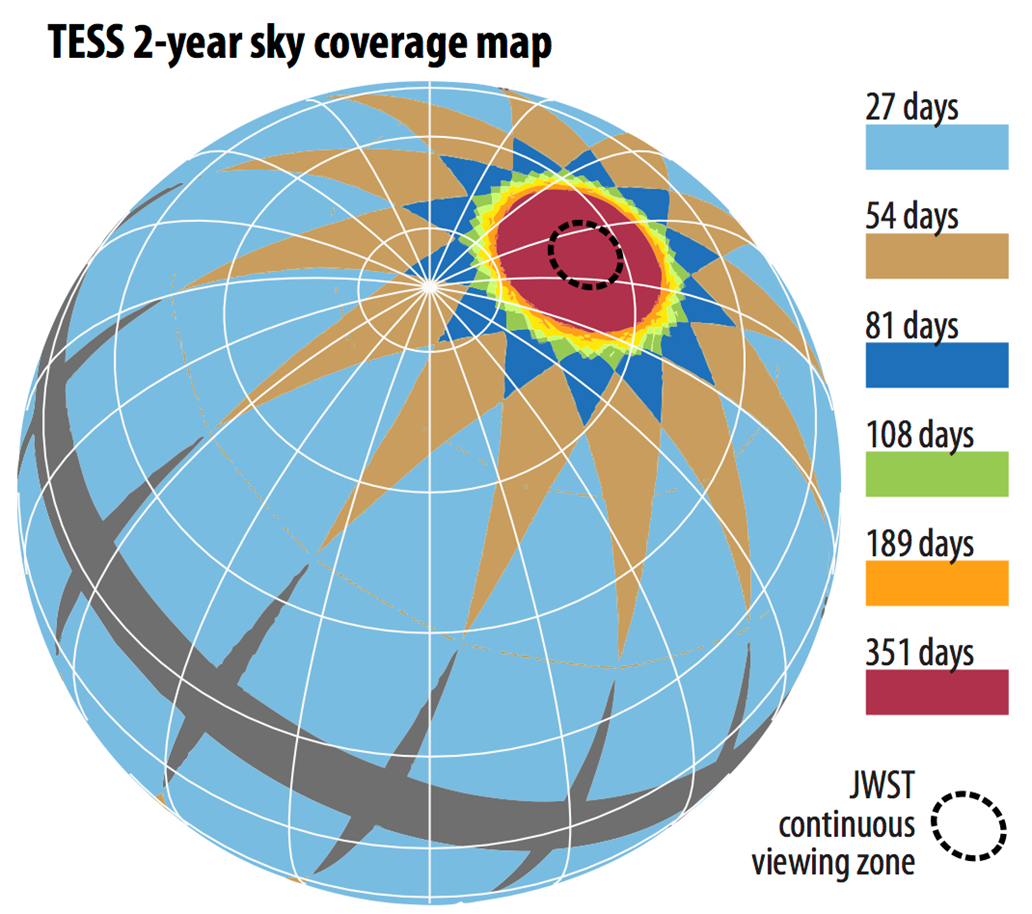 During the first day, I got quite a bit of information about stars, rotation, magnetism, and much more. Travis gave me some work to help me understand what he does day to day. First, I was given a 1995 article with data sets on naked-eye stars, and I was to determine whether they had a long solar cycle or seemingly none. I was given another, more recent article and tasked with the same thing. Next, Travis told me about TESS, a telescope in orbit around Earth photographing both hemispheres of our sky. TESS will “tile” the sky in 26 segments throughout its mission, starting with the southern hemisphere the first year and switching to the northern sky the second year.
With all of this information, I took the list of all the stars I had gathered and entered them in a TESS prediction website to determine when (or if) the stars would be observed during TESS’s 2-year journey in orbit. Here is my final list of stars with the dates and specifics of when they will be observed by TESS:
Star Lists (HD)
Long (A barely observable, long solar cycle):
114378 – Sector 23: Mar 18 – Apr 15 2020, cycle 2, camera 1
207978 – Sector 15: Aug 15 – Sep 11 2019, cycle 2, camera 2
176095 – Not observed.
187013 – Sector 14: Jul 18 – Aug 15 2019, cycle 2, camera 2
212754 – Sector 15: Aug 15 – Sep 11 2019, cycle 2, camera 1
17925 – Sector 4: Oct 18 – Nov 15 2018, cycle 1, camera 1
Flat (a solar cycle that appears non existent, or too long to have been measured):
124570 – Sector 24: Apr 15 – May 13 2020, cycle 2, camera 1
216385 – Not observed.
142373 – Sector 24, Apr 15 – May 13 2020, cycle 2, camera 3
190360 – Sector 14: Jul 18 – Aug 15 2019, cycle 2, camera 2
Flat? (a solar cycle that appears flat but does not fit the specifications exactly):
159332 – Sector 25, 26: May 13 – Jul 4 2020, cycle 2, camera 2
23249 – Sector 4: Oct 18 – Nov 15 2018, cycle 1, camera 1
From second data set:
Long or Flat:
1461 – Sector 3: Sep 20 – Oct 18 2018, cycle 1, camera 1
4307 – Sector 2: Sep 20 – Oct 18, 2018, cycle 1, camera 1
10307 – Sector 17,18: Oct 7 – Nov 27 2019, cycle 2, camera 2
13421 – Not observed
43587 – Sector 6: Dec 11 – Jan 7 2018/19, cycle 1, camera 1
88986 – Sector 21: Jan 21 – Feb 18 2020, cycle 2, camera 1
90508 – Sector 21: Jan 21 – Feb 18 2020, cycle 2, camera 2
120136 – Sector 23: Mar 18 – Apr 15 2020, cycle 2, camera 1
Other:
126053 – 22? – Sector 24: Apr 15 – May 13 2020, cycle 2, camera 1
95735 – var – Sector 22: Feb 18 – Mar 18 2020, cycle 2, camera 1
Day 2:
I worked with another researcher today whose name is Regner Trampedach. Once again, I interviewed him for a while to gain a better understanding of his work and why it is important. His main job is to present information through simulations. Regner showed me a simulation that he had been working on of the surface of a star. There is a lot of coding that goes into making these and refining them. He explained that the small clip took about 6 days to complete.
After that, he tasked me with reading two papers. The first was a magazine article about the formation of black holes. There are very bright quasars that are predicted to be the light emitted from or around a massive black hole. The problem is, these quasars are very old, and with our current understanding of the timescale of the universe, these should not have been able to form in such a short time. There were several theories trying to explain how this is possible. I found this article particularly interesting because it shows that observing an anomaly can make us rethink all that we know.
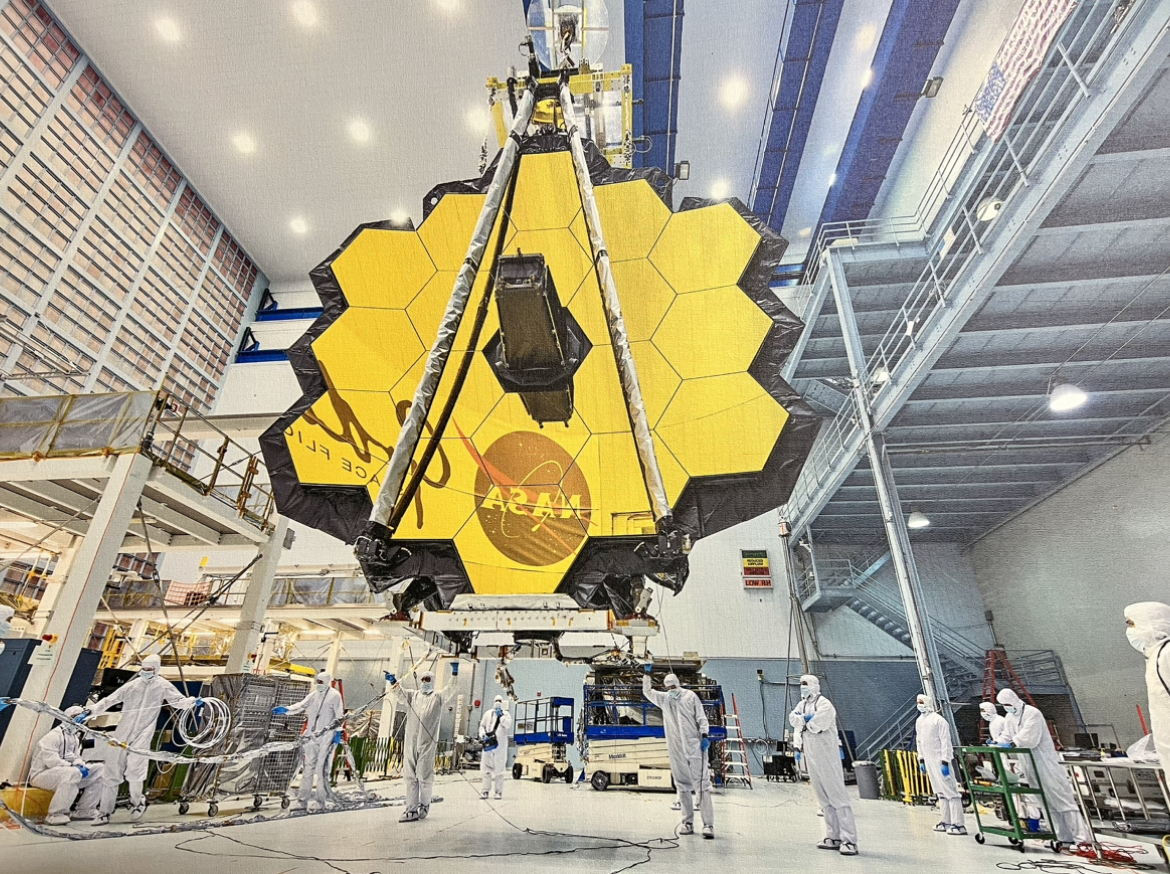
The second was a long research paper about the shadow of the supermassive black hole recently photographed, and how they were able to do it using many different telescopes across Earth. The scientists had to piece together the full picture from each source, and go through extensive data processing and analyzing. I was impressed by how much work went into taking this picture that I did not know about beforehand.
Next, Regner gave me a worksheet to calculate the radius of the event horizon and the mass of several black holes. Another part of this was to determine when spaghettification happens (which is a lot less fun than it sounds) for a human on or before the event horizon. I calculated these things many times before coming to my final answers, which took a while. In the end, I had a sheet of information that showed the dimensions of each black hole. It was quite gratifying seeing all the work turn into something more tangible in the end, and I got an idea of the long process that astronomers take to calculate and understand things.
Day 3:
Today I met with Angela Santos. She is a scientist at SSI who analyzes star data from the Kepler mission and a database. The work she does relates to asteroseismology, and she also studies the rotation of stars. Angela had me read a portion of the Theory of Stellar Oscillations. Then, I was given a set of star data, and I plugged this data into a coding system that allowed me to determine the properties of the star, like the frequencies and power. This data was then used to compute what the radius and mass of these stars are. This was a rough calculation, and the codes are much more specific when finding the values professionally. This was the first time I had worked with coding, and although it was very simple (I used python), there was a learning curve. After this, I read an article about helioseismology and the different ways that the properties of the sun can be found.
 Day 4:
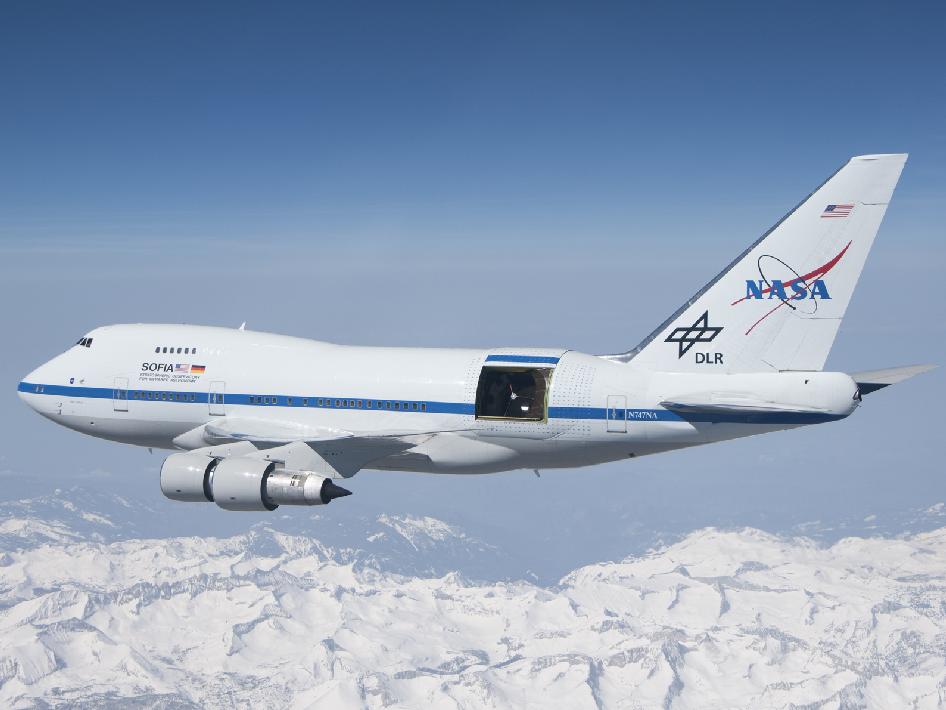
Today was my last day with a scientist. The person I talked with today was Sachin Shenoy. His current daily work involves taking data from SOFIA; an airborne observatory that captures data in infrared, and fixing the data to show the most accurate picture. The official name for this is ‘data pipeline calibration’. Once this data is finalized, Sachin puts it into an archive where other scientists can use it to do their own research. Another part of his work is to compare the data that he has to the data of previous research. This has many uses, one of them being finding outliers in the initial data to understand the errors of the instrument or the methods. Sachin is a great example of someone who fought the odds to be working in astronomy and is appreciative of his position and the work that it took to get him here. I have a lot of respect for that. His work holds a very important part overall because it allows the rest of the world to discover and research clear, refined data.
Leave A Comment